Join over 10,000 nonprofit professionals who receive frequent fundraising and staff management tips.
Food & Friends
Happy Holidays from Campbell & Company
Building a Resilient Organization Series: Vol. V
Campbell & Company’s Strategic Information Services
Natural History Museum of Los Angeles County
Digital Donor Engagement
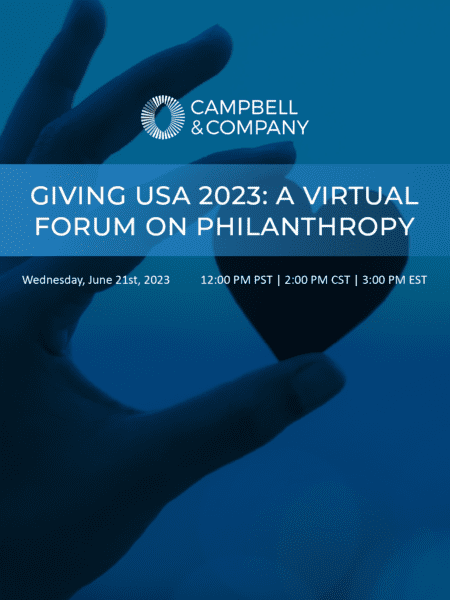
Giving USA 2023: A Virtual Forum on Philanthrophy
Deep Clean Your Database
Spruce Up Your LinkedIn
Spring Cleaning: Clean Up Your Donor Records
Dust Off Your Case for Support
Success Story: Disability Community Resource Center
We’re ready to invest in your success. Are you?
Partner with us today